Crash Strategy – Waiting Peaks
One effective strategy for gambling crash games such as Aviator, Lucky Jet, Spaceman, and others is based on collecting and analyzing game results using graphs. This method is of medium complexity and best suited for players who are willing to invest time and approach the game systematically.
The core idea is to track the multipliers from each round and record them over a long period. By plotting these values on a graph, patterns and tendencies become easier to spot—such as sequences of low multipliers followed by occasional spikes (pikes). Although the game’s outcome remains random, identifying these trends can help players adjust their betting behavior more rationally.
The strategy is most effective when applied from a personal computer, allowing for better data management and visualization. With enough information, players can estimate favorable moments to enter or cash out, improving discipline and decision-making.

Selecting a gaming platform and collecting data
Before analyzing Aviator (or another crash game), the first step is choosing a casino. Each player makes their own choice, but I settled on 1Win. It’s important to note that demo mode is not suitable for this strategy — its outcomes differ significantly from real gameplay, which is easy to confirm through comparison.

Once you’ve chosen your platform, register and make a small deposit. At this stage, the goal is not to bet, but to observe and collect data. Carefully track and record the results of at least 100 game rounds. This will provide the first foundation for analysis.
To make your observations more accurate, it’s best to repeat the process several times during the day. This will help identify patterns, fluctuations, or tendencies in different time periods. This is what we got:
| 2.24, 23.72, 1.04, 1.71, 1, 2.24, 1, 5.17, 1.13, 8.34, 5.36, 2.37, 11.33, 1.34, 1,2.16, 1, 22.92, 1.50, 8.62, 1, 1.07, 1.20, 2.42, 1.40, 8.72, 3.71, 1.23, 2.06,1.18, 1.59, 1.24, 1.91, 1.70, 1.71, 4.60, 1, 4.05, 1.91, 1, 2.48, 2.60, 1.26,1.29, 1.25, 1.14, 4.00, 1.29, 1.92, 1.26, 1.51, 22.76, 1.06, 1.16, 1.44, 1.28, 2.27, 1.35, 3.17, 1.61, 1.03, 2.25, 4.41, 2.41, 2.24, 1, 1.77, 4.18, 1.31, 1.45,1.59, 1.39, 1.52, 1.20, 1.59, 1.43, 1.14, 1.04, 1.15, 1.00, 5.35, 1.05, 7.05, 1.51, 13.23, 3.24, 1.65, 2.46, 3.89, 2.63, 2.60, 9.84, 1.23, 2.02, 9.30, 1.34, 1.18, 1, 1.29, 2.88 |
Plotting graphs
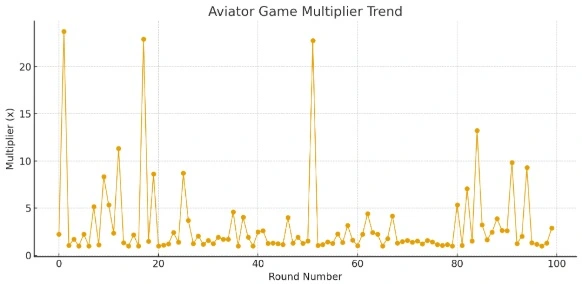
In the next step, we need to visualize the collected data. This will help us clearly see patterns and understand how multipliers behave over time. To do this, open ChatGPT in your browser and simply type the following phrase:
“Plot a graph and analyze the results for the Aviator game (copy our 100 results).”
Within seconds, you’ll receive a graph that shows how the multipliers change and whether there are noticeable sequences or spikes.
As a bonus, you will receive a percentage table with risks.
| Range | Probability | Expected Return Contribution |
|---|---|---|
| 1.00–1.50x | ~45% | Small loss zone |
| 1.50–3.00x | ~30% | Stable return zone |
| 3.00–10.00x | ~20% | Moderate profit zone |
| >10.00x | ~5% | Rare jackpot events |
To make the graph more informative, we’ll adjust the maximum game results (peaks) to an average value, such as 10. Then, let’s plot another graph with the adjusted data.
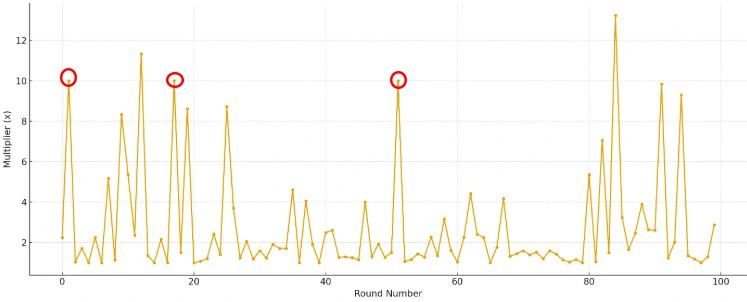
Calculation of the game Aviator
In the next step, we’ll move on to calculations. Using the collected data, we’ll determine two key values: the average multiplier, which we’ll set for automatic withdrawal, and the interval between peaks — the moments when the multiplier reaches higher values. By calculating this interval, we’ll know when it’s most profitable to place a bet. This step forms the foundation of the strategy and helps minimize random guessing.
In the same chat with the AI, we ask it to plot the median on the graph. To do this, we type the following phrase:
“draw the median”
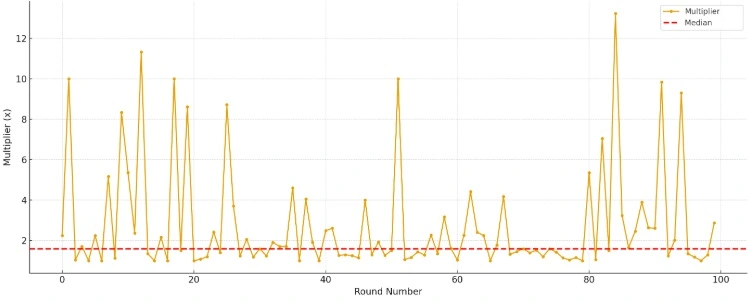
The median lies between 1.5 and 2. For convenience, we round this value to the nearest whole number 2. This gives us a 2X auto-output multiplier.
Now we need to calculate the average number of rounds where values below 2x were rolled in a row. If there’s only one multiplier below 2x between the vertices, we skip it.
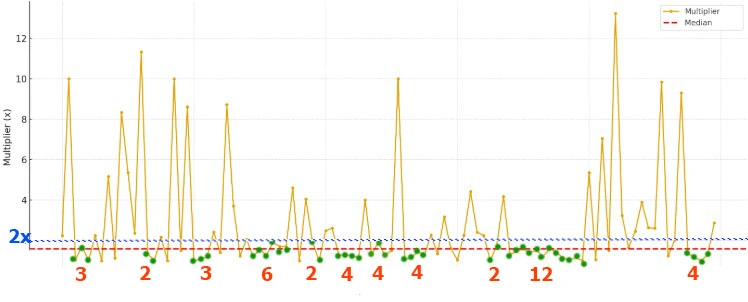
We get the following results:
| 3 | 2 | 3 | 6 | 2 | 4 | 4 | 4 | 2 | 12 | 4 |
Let’s calculate the average number: (3+2+3+6+2+4+4+2+12+4)/11=4.182. Rounded to 4.
To get a more accurate result, collect and calculate the data from the Aviator game several times a day or week (as long as you have the patience).
Applying Calculations in a Crash Game
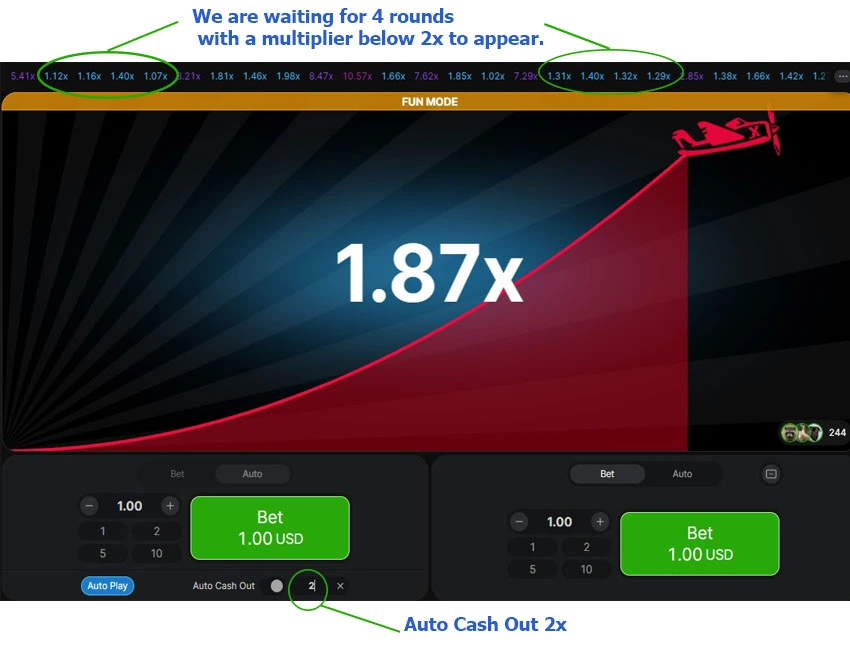
After completing several calculations throughout the day, we can determine two key parameters for our strategy: the average multiplier for automatic withdrawals and the interval between rounds at which we’ll place our bets in the Aviator game.
In our example, after three additional calculations, we confirmed the values “2x” and “4 rounds.” However, keep in mind that your numbers may differ. Each platform and time of day can have its own unique pattern, so it’s crucial to base your strategy on your personal observations and data.
Next, apply these values in practice: wait for 4 rounds to close below 2x, and then place an automatic bet at 2x. After that, observe the game again, wait for another four rounds below 2x, and repeat the same action.
Conclusion
This crash-strategy won’t guarantee a win every time, but it helps bring structure and stability to your gameplay, increasing your chances of making more accurate bets. You can also combine this method with the Martingale strategy, doubling your bet after each loss to recover previous losses and make a profit. This approach gives room for experimentation and allows you to adapt the system to your style. Over time, you may discover your own variations of this method, tailored to your playing habits and risk tolerance.